If you are a DevOps engineer, systems engineer or SRE, it’s invaluable to have a lab environment that gives you free space to explore, build, break, fix, break, refactor, rebuild… and rebuild any part of the infrastructure you wish to work on.
Goals and Philosophy
My approach to building out my lab environment is absolutely specific to what I consider practical and efficient for my usecases.
In this series of posts, I will go over specifics my infrastructure. In order to keep this post consise, I’ll give an overview of choices I made when building this out without going too deep into specifics. I’ll do more targeted how to’s in future posts.
Server hardware and hosting overview
Server Specs:
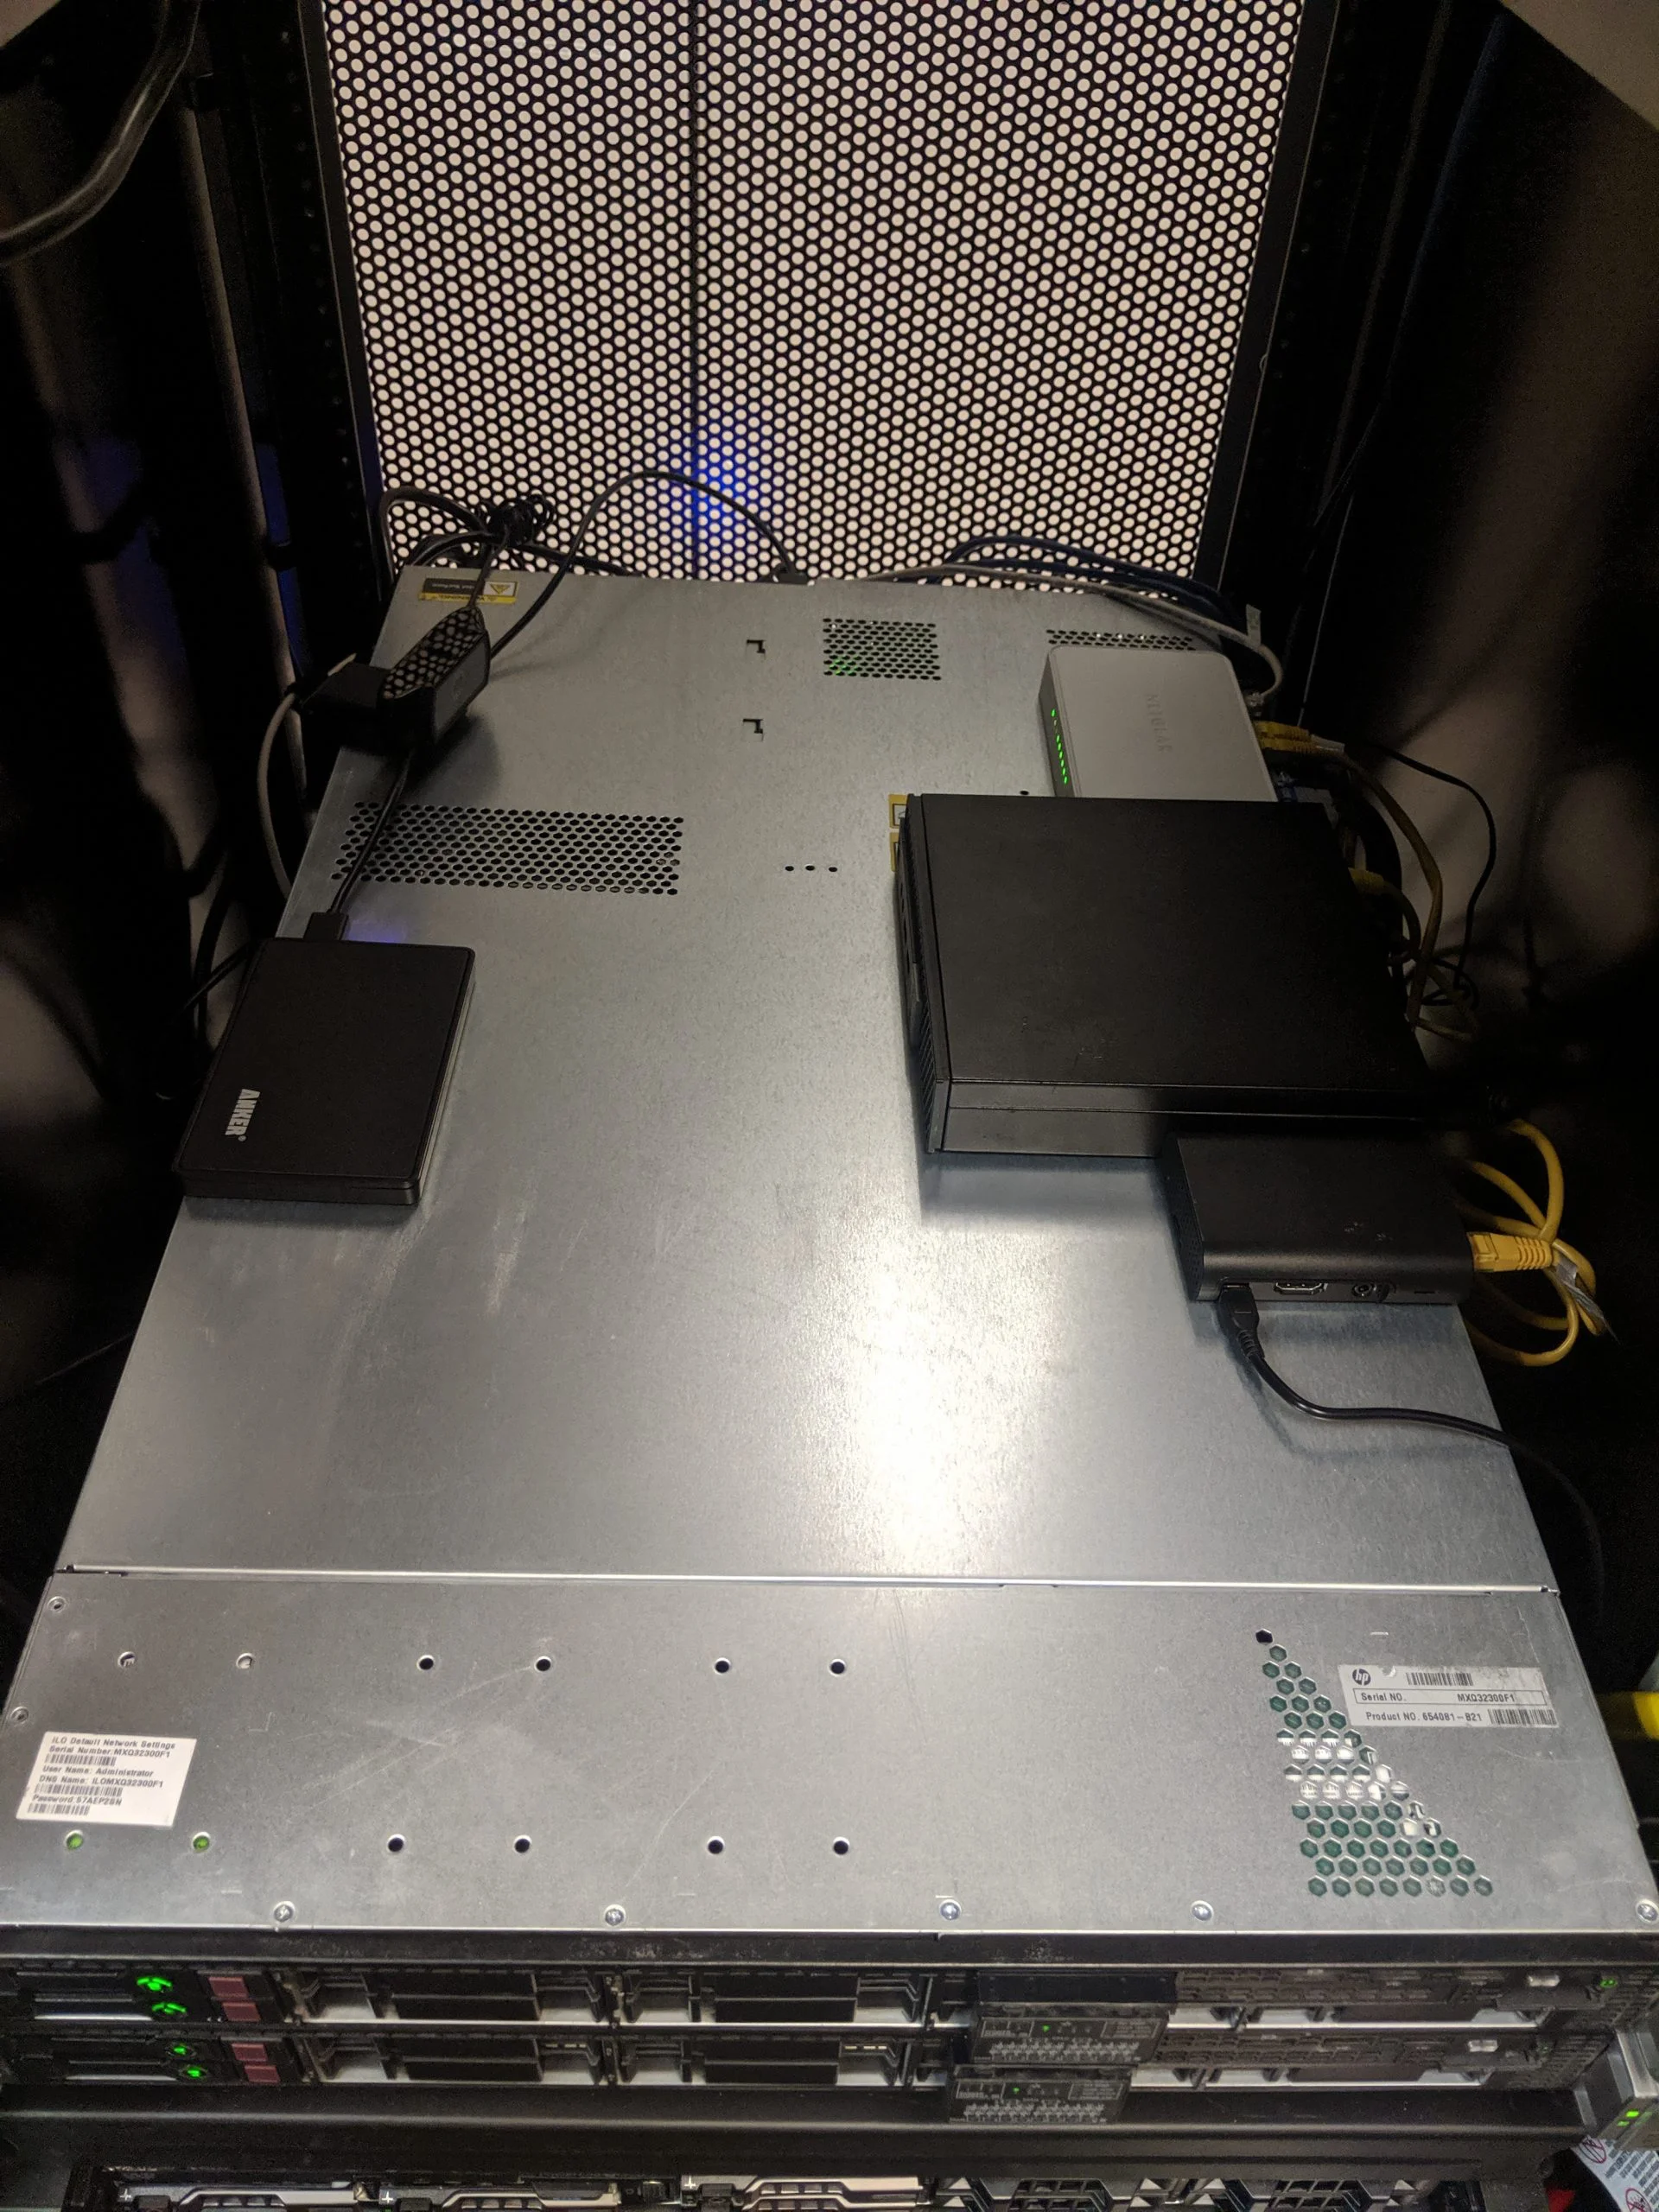
- 2 x HP Proliant DL360 Gen 8 1u servers
– Memory: 64GB
– CPU: 32 core Intel Xeon processor
– Disk: 2 x 1 TB disks
- 1 x Dell Ultra small form factor
– Memory: 8GB
– CPU: 4 core Intel i5 processor
– Disks: 512 GB SSD
- Raspberry Pi 2
– Memory: 1GB
– CPU: 4 core
– Disk: 128 GB micro SD
- 1080p webcam
The main workhorses are the DL360 which is where I run all the LXD and docker containers. The Dell server is set up mostly like the HP DL360s with the exception of the extra configuration for setting up the ILO (Integrated lights out). But it can run containers if and when necessary. It also runs a DHCP server that issues IP addresses to the LXD containers
The raspbery pi is there as a backup entry point into the network. The ILO ports on the HP servers are OBVIOUSLY not publicly available so I access them by port forwarding through an SSH connection.
Hosting
Being that these are enterprise grade servers that are loud, power hungry, awkwardly shaped beautiful servers, I had two options; get a small rack and stick the servers in the garage, or host them in a colocation facility. I chose the latter. I found a small colocation company in the Seattle area and pay monthly for two 1u server slots in a rack.
The main reason for choosing to host the servers in a colo facility is that I plan to run services that need high network and power availability. These are requirements that cannot be acheived by running the servers at home. Plus, it’s nice to have a lab environment that’s set up the way that mimics the real world natural habitat for enterprise servers.
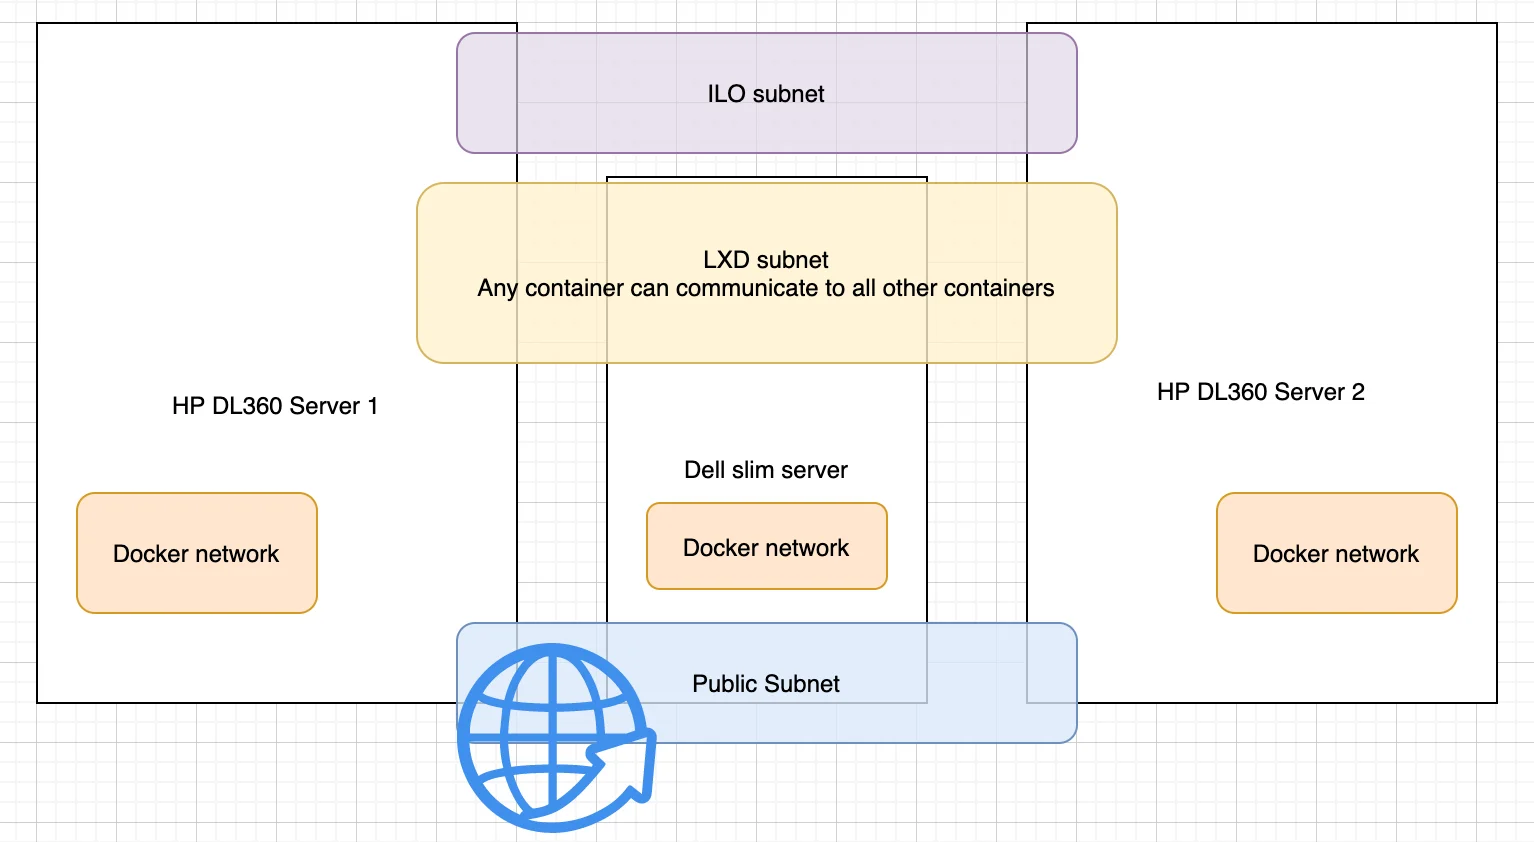
Networking
My goal for the network was to separate have a separate subnet for the different pieces of the network that are related.
- Public network
- LXD container network
- Docker network
- HP ILO network
I have all the systems connected to a Netgear 8 port Gigabit switch. There is a separate network for the LXD containers. This allows all the containers to communicate across machines in a flat 10.x.x.x network. The last network is for the ILO. I wanted an ILO network that is separate from the other networks. This is only accessible when I’m connected over VPN, or if VPN is not available, I can reach the ILO through an SSH tunnel from either the Dell compact server or the raspberry pi.
Firewall
Network connections are limited to the VPN port, 80, 443 and 22. Nothing fancy here, just iptables managed with Ansible. I couldn’t find an ansible role that worked the way I want so I modified an existing role that was close enough to what I needed. I added the customizations and fixed the bugs I encountered, particularly around managing docker and LXD IPtables entries.
To protect against the constant SSH attacks I use sshguard. Nice app written in C so it’s blazing fast and light on resources
I used fail2ban for a while until I discovered that it became a CPU scorcher. Astonishing to see how many SSH attacks are made constantly.
Configuration management
Ansible was my choice for gluing all the pieces of this infrastructure together. I used ansible briefly about 6 years ago, then some chef, then puppet for a long time. These tools differ in their approach but ultimately aim to solve the same problem. The dilema I have is, I find myself missing the way puppet is able to converge a node based on a regex host pattern, I like being able to create and converge a node simply based on the host pattern. I didn’t use a puppet master at the time, I had a script on the server that pulled the puppet code from a git repository and ran puppet apply to converge the node based on the hostname pattern. This is a great method that scales excellently. Ansible has a simlar tool ansible-pull that can be configured to point to a git repo and converge a node based on the host name and group/playbook association. I will give it another shot at some point and see if ansible pull can converge based on a regex host pattern or even wildcard.
At this point I will likely just stick with Ansible as I have put in a lot of time onto developing roles that do specific things, and converted my puppet modules I wrote to Ansible roles. Meh… I have not tried out saltstack yet, but for now Ansible is the one for me.
I also use Terraform 12 to manage LXD containers, DNS records using cloudflare and some of my experiments Vultr and DigitalOcean (get a $100 credit on Vultr or DigitalOcean). They all have great terraform providers that helps with easy resource management. I thought about just using ansible for all of it… but I wanted some data wrangling practice with Terraform so that was that.
Service Discovery
All service discovery is managed using Consul. Being that this is a small environment, I use one consul server which works great. I decided not to run it clustered because I have only 3 nodes that can possibly run consul. In the end, my consul server is stateless so replacing it is extremely easy.
To have a common base configuration across all containers, I have a base Ansible role that all servers and LXD containers run. The base role configures the firewall, installs the consul client, sets up filebeat for logging, installs node exporter to publish system related metrics for prometheus to scrape (more about this in the Observability section).
Observability
Observability refers to metrics, tracing, event logging and alerting. These are absolutely essential for any infrastructure, otherwise you are flying blind and end up chasing avoidable infrastructure issues.
For my infrastructure I’ve chosen the following:
- Metrics: Prometheus and Grafana
- Tracing: Kibana
- Event logging: Graylog
- Alerting and notification: Alertmanager that sends notifications to slack
Metrics: Prometheus and Grafana
Prometheus is an open-source systems monitoring and alerting toolkit originally built at SoundCloud.
Prometheus is configured to watch Consul for configured services and scrape them periodically. This ensures that new servers get monitored without having to lift a finger. Any new service registers itself with Consul, and prometheus automatically finds the new service and begins collecting/scraping metrics. Grafana is great for visualizing the prometheus metrics and has been adding some interesting visualization options and improvements.
The ELK stack is amazingly awesome and keeps getting better and better. It can now be used for collecting metrics, logs and application performance monitoring (APM) and the list keeps expanding. I am keeping an eye on the logging functionality and will consider replacing Graylog with Kibana to reduce my logging infrastructure footprint. For now, I’m running Graylog.
Alerting and Notification
The Alertmanager handles alerts sent by client applications such as the Prometheus server. It takes care of deduplicating, grouping, and routing them to the correct receiver integration such as email, PagerDuty, or OpsGenie. It also takes care of silencing and inhibition of alerts.
Alertmanager is setup in a peered configuration. It’s currently configured to send alerts to Slack.
Reverse Proxy (routing)

Oh this is a fun one. So now I have all the services running within the internal network, I needed a way to route traffic from the interwebs to one or more of the numerous services within the network.
The physical servers are completely locked down and only listen for SSH, HTTP or HTTPS connections.
I use Traefik for all my routing needs and it is awesome and an absolute breath of fresh air to use, compared to Envoy (more about this later). The best part of using Traefik is it’s automatic SSL certificate management using Lets Encrypt – set it and forget it. This is gold.
Traefik supports HTTP and TCP routing. It’s configured using enrtypoints, routers, middlewares, services. It natively supports consul and can be dynamically configured using consul tags to configure routes in Traefik. It also watches a dynamic configuarion file that auto loads changes during runtime without a restart. This s gold.
A prometheus metrics endpoint is also exposed for easy monitoring of Traefik, which fit in nicely with my setup.
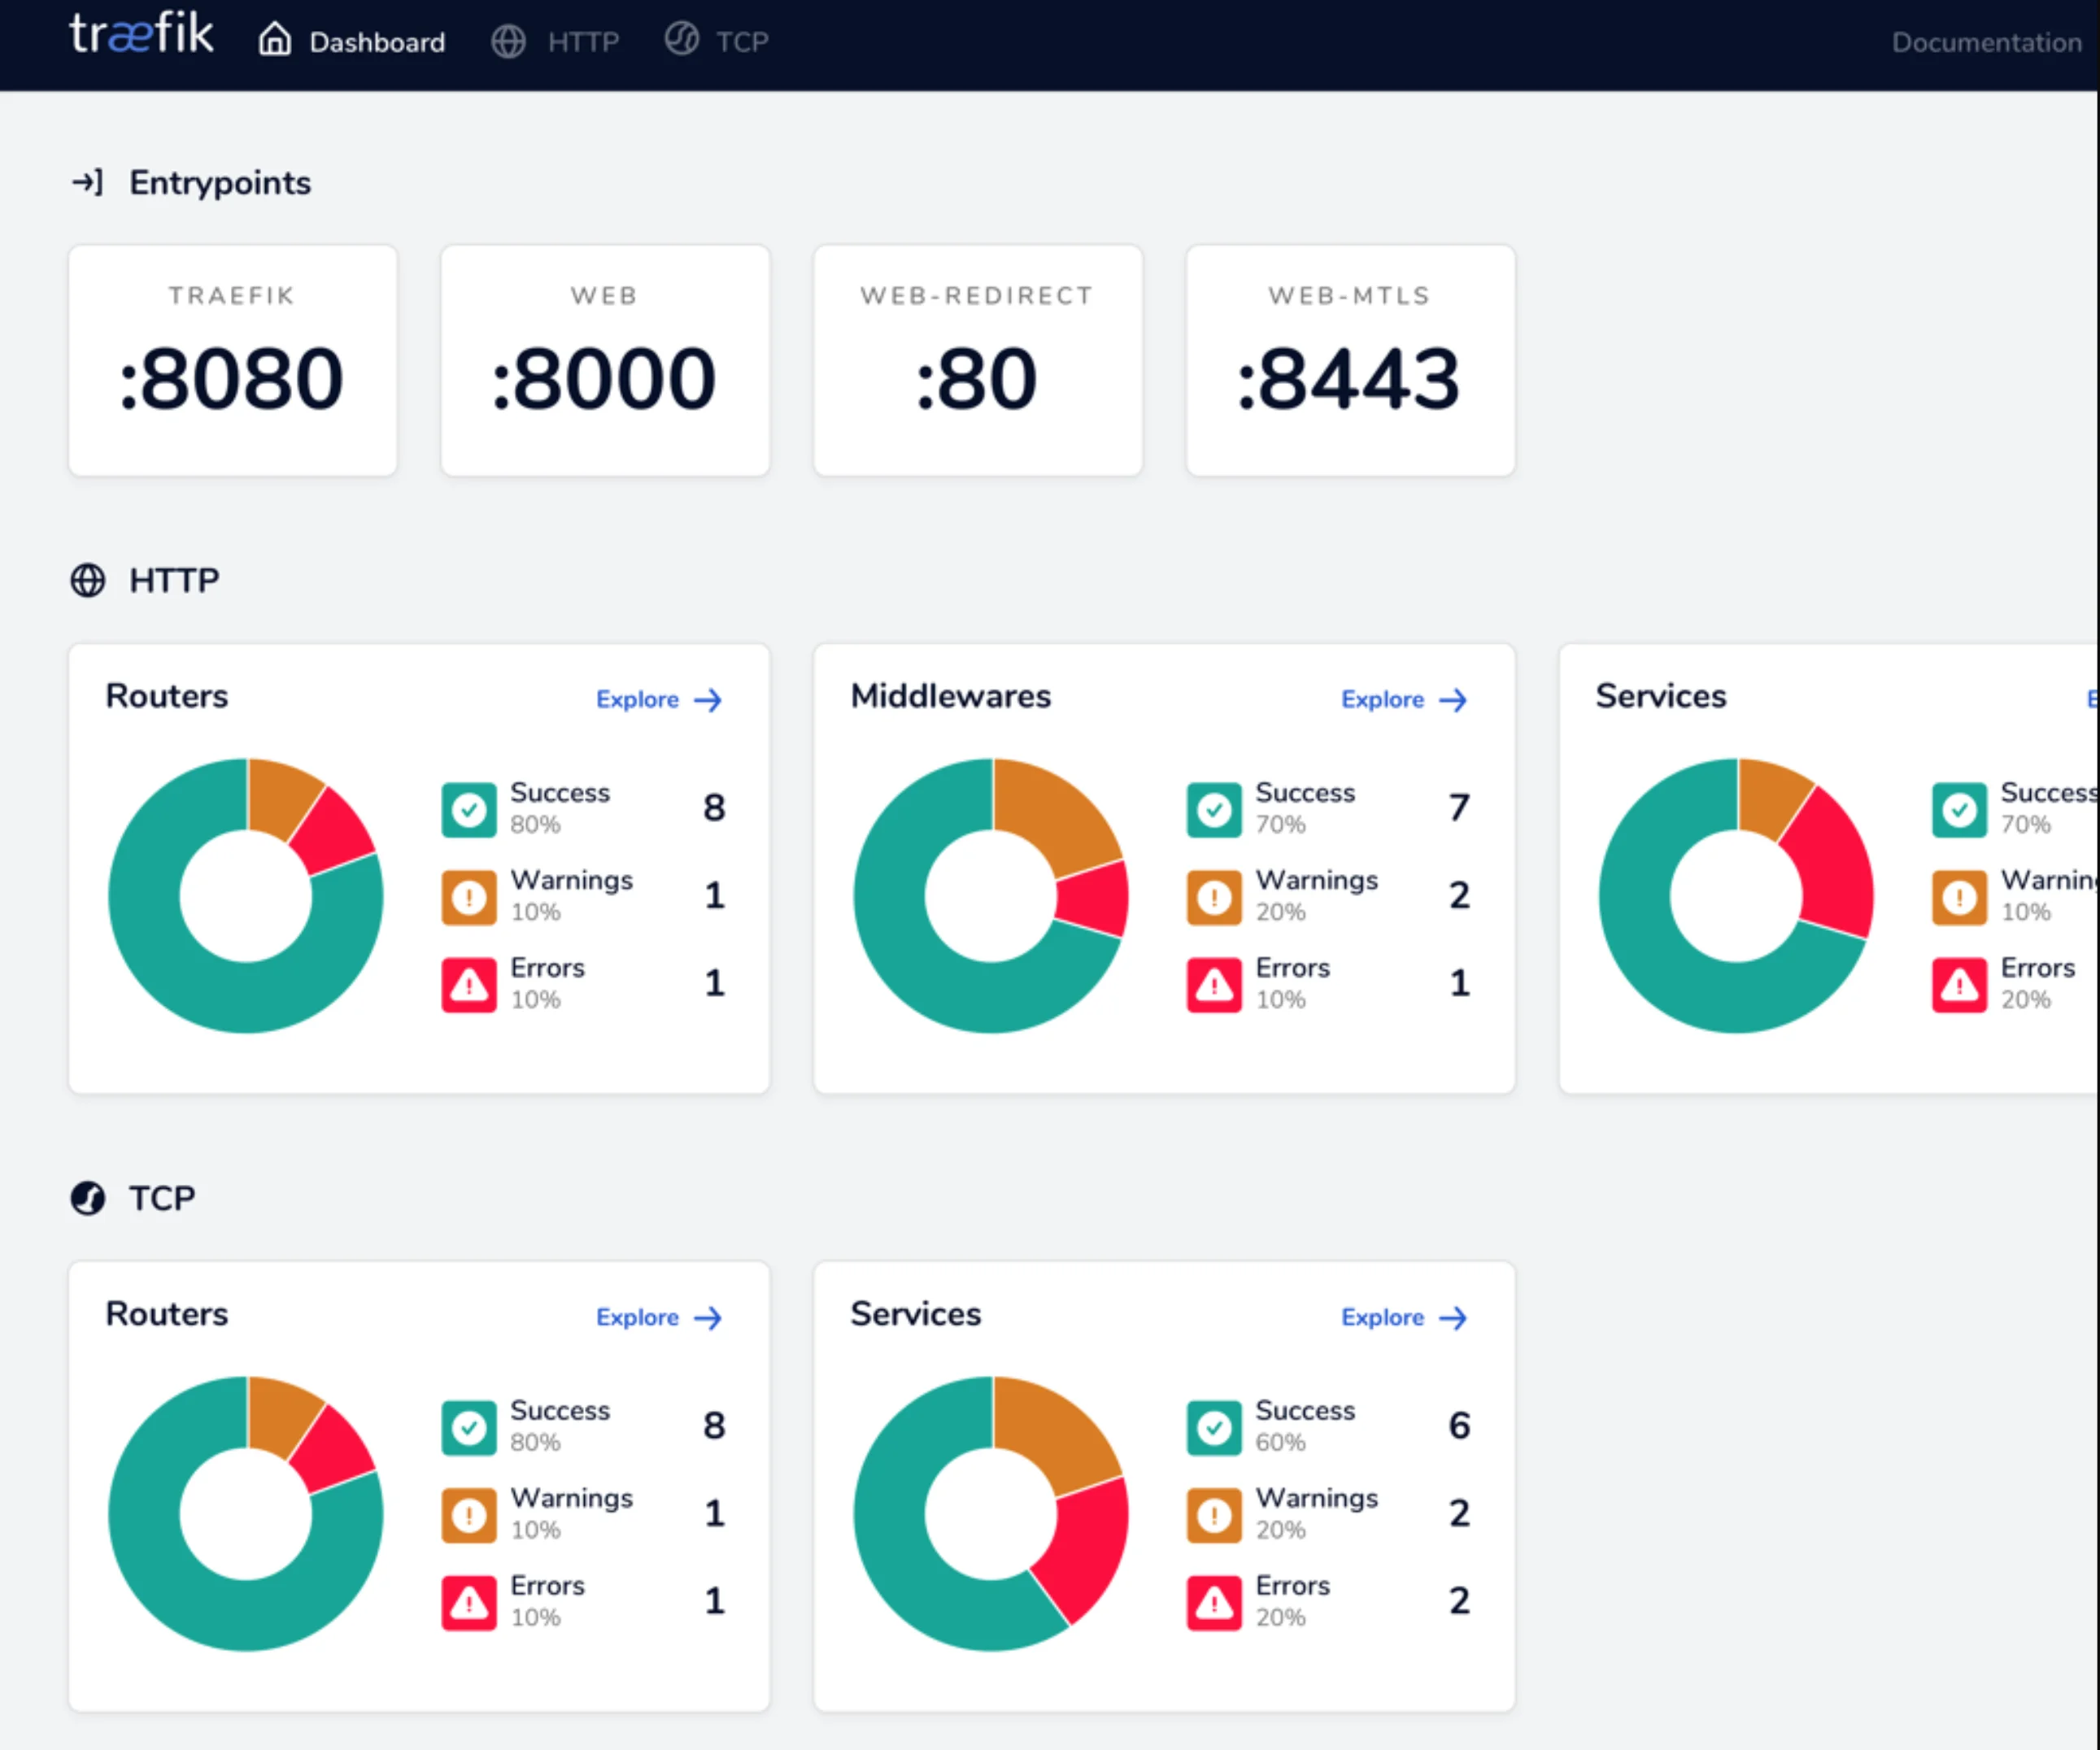 Traefik Dashboard
I initally started off with Envoy because I was learning envoy at the time for a project at work. But yeah, Envoy in all it’s awesomeness is NOT USER-FRIENDLY AT ALL. Seemingly simple things take the longest time to configure. WHY? because envoy is not supposed to be configured by humans, it is typically used with control planes like Istio. Envoy is the data plane. More about this here…
I switched to Traefik after using envoy briefly and it’s such a breath of fresh air to have such powerful simplicity. I’m a fan. Waiting for them to implement pluggable middlewares so I can implement custom middlewares when necessary.
There is a lot to cover with Traefik so I’ll stop here. Learn more here….
Conclusion
A lot of the motivation for building out this infrastructure is to provide a space where I can run build and tear down whatever my heart desires. I also run wife’s business website there because… why not.
The next series of posts will be specific to a part of my setup.
Happy building….